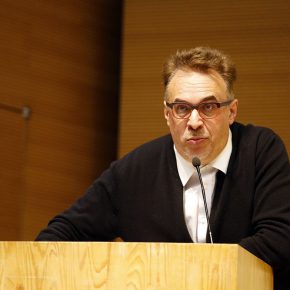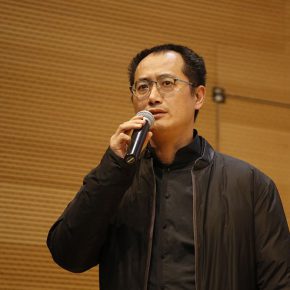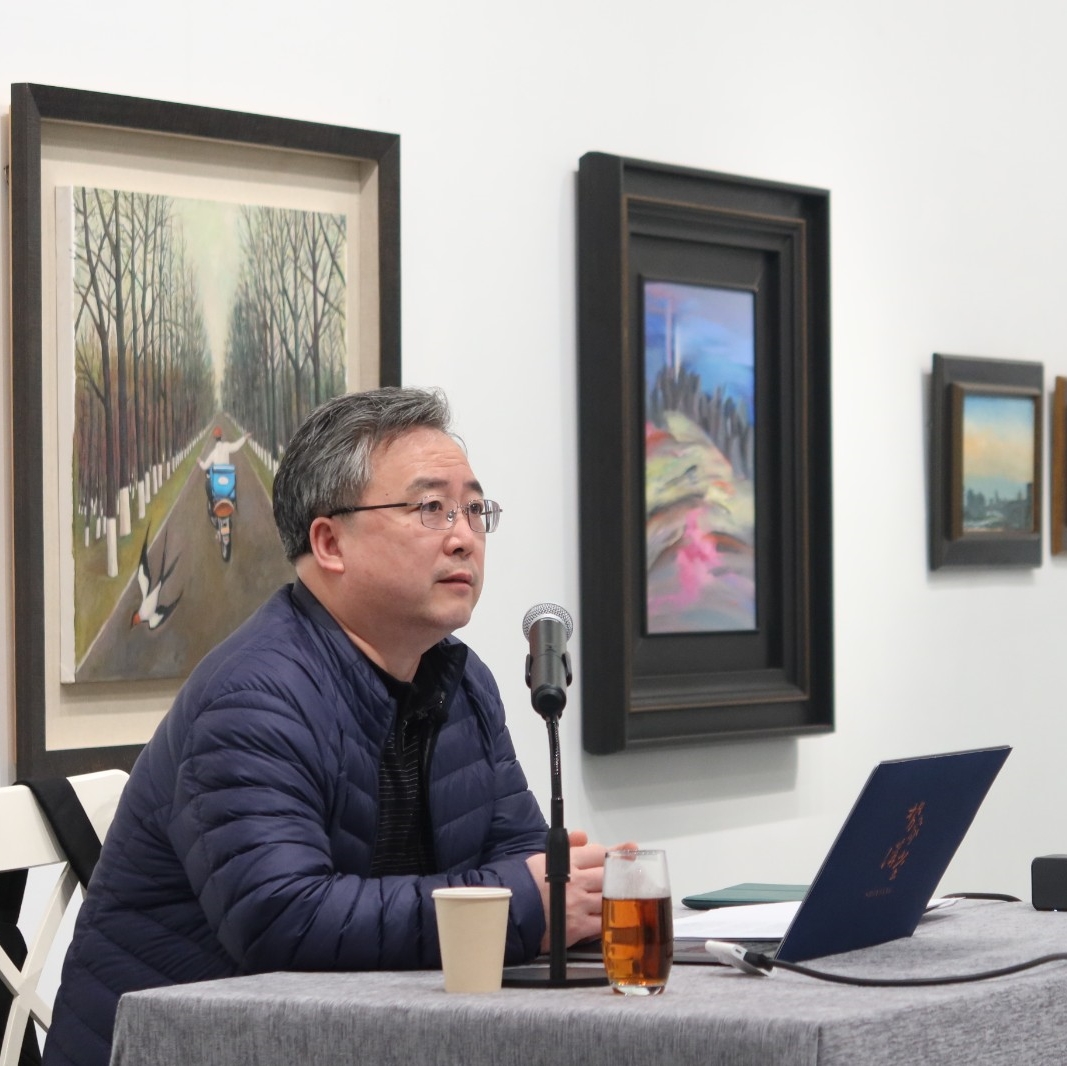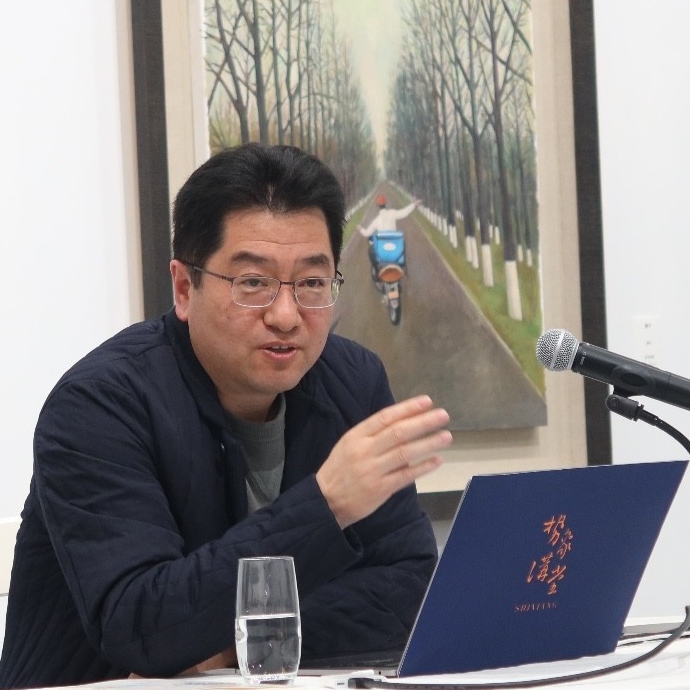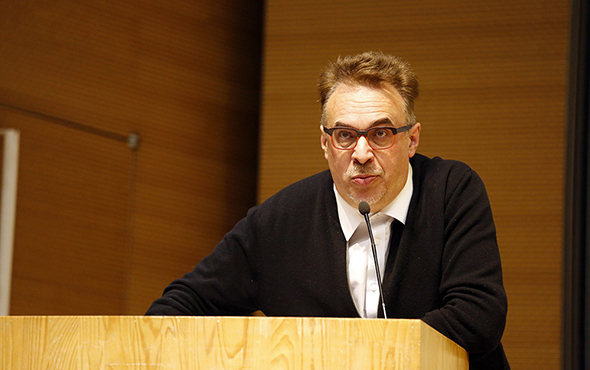
On November 7, Dr. Lev Manovich, Professor from the City University of New York gave a lecture entitled “Visualizing World’s Image: the art, design and science of big cultural data” in the Auditorium of the CAFA Art Museum. Qiu Zhijie, Dean of the School of Experimental Art, CAFA, presided over the lecture. This lecture is part of the first EAST (Education, Art, Science and Technology) Season, held by CAFA in 2017.
Lev Manovich was born in 1960. He studied painting, architecture, computer science and?semiotics in Moscow, spending several years practicing fine arts till he was 20 years old. He moved to?New York?in 1981, and his interests shifted to virtual space, moving images, and digital media. While in New York he received an M.A. in?Experimental Psychology?(NYU, 1988) and additionally worked professionally in 3D computer animation from 1984 to 1992. He then went on to receive a Ph.D. in Visual and Cultural Studies from?University of Rochester?1993, and then he started to teach in the university, and he researched and taught new media art. In 2014, he became Professor of Computer Science, the Graduate Center, City University of New York, and started teaching “Data Analysis”. He is an artist, computer animator, designer and programmer. Because of his own experiences, Manovich encouraged students to study both fine arts, and other professions such as politics, economics, architecture, engineering, etc. It also explains the motivation and methods for the following projects.
About 2 billion images are shared on the internet every day. How can we accept so much visual information? What kind of content do people share on social media? Manovich then introduced several cases on these issues. In 2007, Lev Manovich established the lab.culturalnalaytics.info, and these projects were finished by the data artist, media designer in collaboration with the data scientist in the laboratory.
One Million Manga Pages (2010)???????????“If the manga book has a visual style, what is the visual style of a manga book?” and then the lab conducted a project of “One Million Manga Pages”, whose contents came from a million scanned pages from the manga fan forums, approximately 90000 manga books. The use of software to have a project analysis, the computer visually analyzes and summarizes each page, and visually classifies an hundred manga pages under certain standards, thus each page is placed in a data-based visualization view. Through this analysis one will find that the above question can’t be answered. Questioning it in another way, in a particular period of time, why was a style more popular? By choosing a corner, you will find that the visual style tends to be uniform in a certain area. The cartoonists find what people like to see, and choose a more competitive creative style. This visual style analysis can be applied in other fields such as cinema, fashion design and architectural design, and also brings together academy students’ works to find the most creative piece, which is different from others.
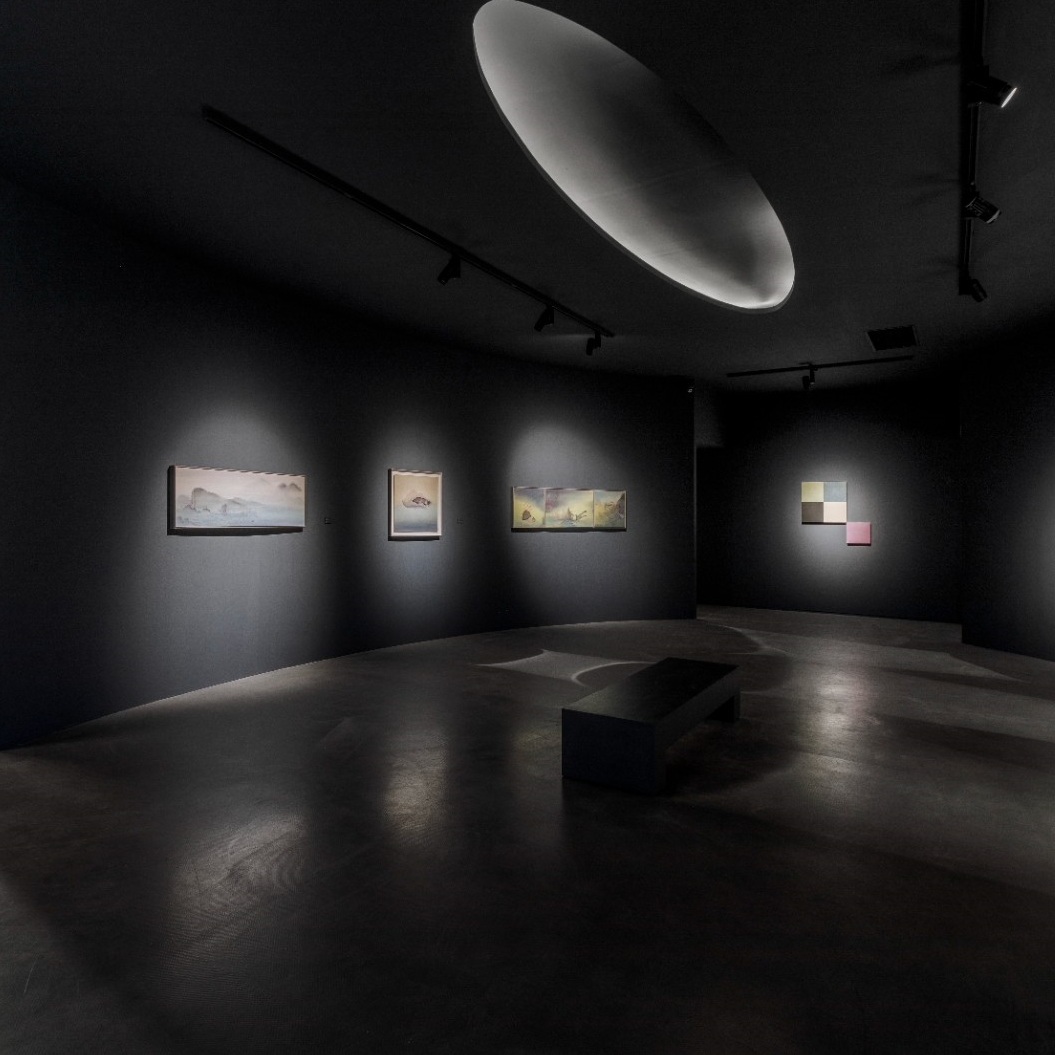
In addition, Manovich gave another case, the visualization of 5000 paintings of French Impressionist artists. Through the data analysis, we can find that the familiar paintings of French impressionists turn to be only 20%-30% of their whole creative output. Most of the works are actually very traditional, while the works in dark colors are ignored by people. It uses data analysis and artificial intelligence: the computer examines each piece and analyzes each piece based on about 60 criteria, such as composition, color and contrast, etc., and similar works are closer, depending on this analysis. The two projects’ subjects are static images, and he then listed two more interactive cases.
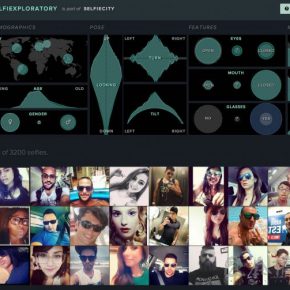
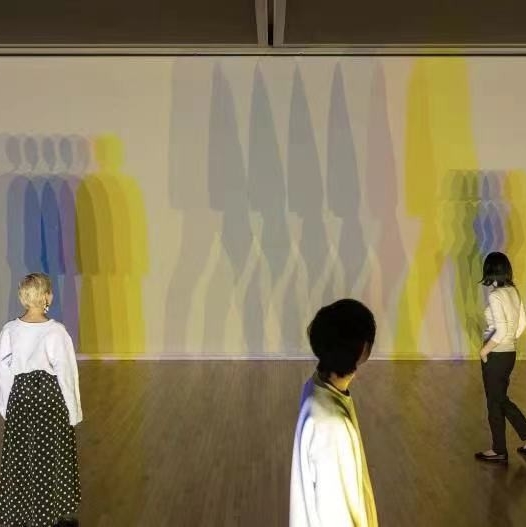
Selfiecity (2013–2014)Users of Selfiecity can interact with a large amount of image data through a computer or mobile phone interface. This project has collected millions of self-portraits in five cities across the world. It uses software to analyze the trend of taking selfies placed on Instagram, to organize the data based on gender and face expression. The project uses a branch of artificial intelligence the computer vision. Depending on the analysis, we find that there are more female selfies than male selfies in each city, especially the female selfie which are 4.5 times more than the male selfie in Moscow; it is even more strange that Moscow’s women didn’t laugh when taking photographs, and they were as serious as taking photos for fashion magazines, which was obviously different from what Manovich saw in the streets of Moscow; the majority of people smiled when they took selfies in Bangkok and Sao Paulo.
Laboratory is another project designed for the St. Paul’s City Festival – a shot film, which is another version of “Selfiecity”. It reminds people that every step of life is tracked in a big city in the current cultural context. Internet companies deliver ads based on big data such as browsing history, payments, etc. of the users who surf the internet, and all our desires, imagination and so on are digitized during these times.
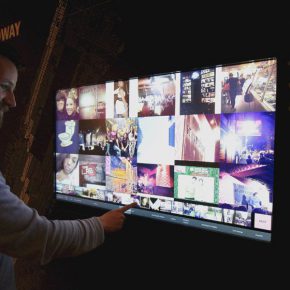
On Broadway (2017)Invited by the Public Museum of New York, the interactive interface of Broadway in New York entitled “On Broadway” was created and finished by using 40 million images and data points. The project took Broadway Avenue as a case, considering Broadway as the horizontal axis, zooming in on what we see as the specific situation of each block, with a large number of Google street view facades and taxi statistics, as well as the government population statistics, and instagram photos uploaded near Broadway over 5 months. It is interesting that this project is connected with a man in his own field: for scientists, it is a science project; for librarians or museum workers, it manages works by data analysis; for designers and architects, it is a new experience and a new way of seeing. The achievements of the project are on display in the 798 Art Zone, Beijing.
Manovich’s work is not narrowly defined as contemporary art. His works are both serious and entertaining, and he uses the scientific methods, artistic means and research methods of the humanities, though this “combination” is doubted by the scientific community, art circles and humanities. However, Manovich undoubtedly believes that the boundary between science and art will greatly shift in our lifetime. iPhone has been around for only 10 years, and we can imagine that a huge technological innovation has just started. In the era of big data, what makes a man? What is the relationship between art and new media or design? After the lecture, Manovich and the students also present at the lecture with a discussion on these issues, which might offer a new direction of thinking.
Text by Wu Huixia, translated by Chen Peihua and edited by Sue/CAFA ART INFO
Photo by Li Biao from CAFA Art Museum (the photos of the artworks from the internet)?